Awhile back I had a trader email requesting I code this indicator for Thinkorswim. At the time I wasn’t able to get to it, and I’ve subsequently lost the email, so I thought I would put this out there in the universe in case he happens to run across it here, and in case anyone else can use it.
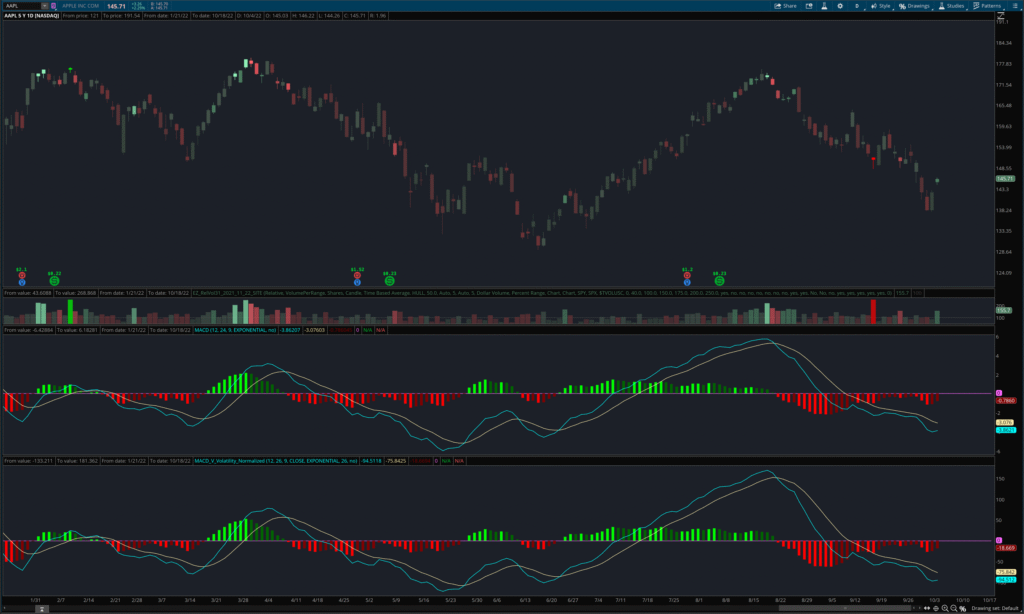
“The output of the indicator is the amount of momentum a security has, that is in excess of its average volatility, expressed as a percentage. We are measuring directional strength, “purified” from volatility fluctuations”
Alex Spiroglou
Traditional MACD vs. Volatility Normalized MACD-V for Thinkorswim
Stocks require liquidity or momentum to push them one way or another, creating the sort of outsized returns that traders are looking for. The momentum that will push prices lower or higher is driven by volume. While there are many different volume indicators, for example, on-balance volume or OBV, there is only a very small number that will combine volume and price to show you who is in control of the market at any given time. This is the volume-weighted average price, which is also referred to as VWAP.
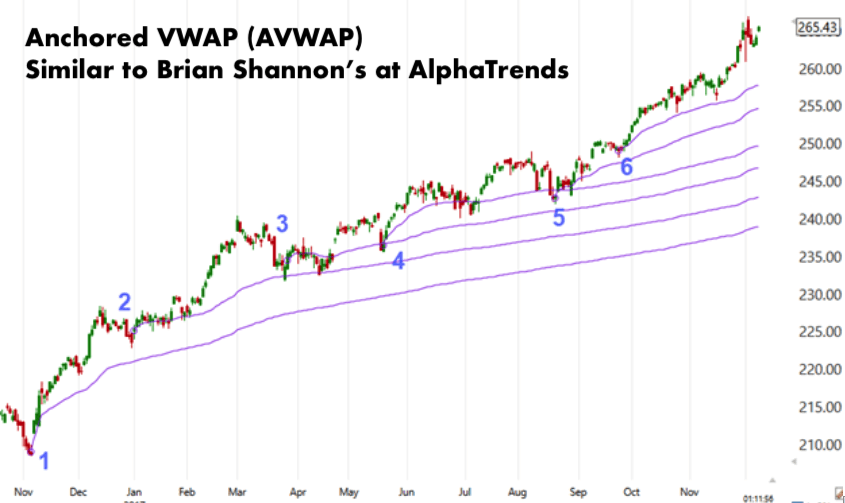
AlphaTrends Anchored VWAP
If you are looking to take your trading to the next level, you may want to consider using the AlphaTrends anchored VWAP to find dynamic support & resistance. This is a popular indicator that both algorithmic and short-term traders use. While it may appear similar to a moving average, volume is factored into the equation with VWAP, ensuring there is improved insight into movements in the market. THE VWAP indicator tends to be drawn as a solo line on a daily or intraday chart. You can easily see example photographs of this if you take a look online.
So, How do You Calculate VWAP?
Now that you know what VWAP is and why it is held in such high regard, we need to explain how to calculate it. The good news is that it is not too complicated! There are three key steps.
The first thing that you need to do is determine the typical price for each period.
You should then multiply the typical price by the volume.
The third part of the process is to keep a running total of the volume and total price by applying the formula:
cumulative TP * V / Cumulative volume. This will enable you to calculate the VWAP.
This calculation will give you a volume-weighted average price for every data point, which you can overlay on the price chart to create an indicator or line.
How can you use VWAP?
There are actually a number of different ways that VWAP can be utilized.
If you are a short-term trader, you may want to utilize VWAP to figure out if the price is oversold or overbought, as well as to evaluate the trade fills. Should a long trade be filled above the VWAP, it could indicate that the trader has gotten a subpar fill.
Another way that we see VWAP being used is by institutional traders to move in and out of stocks with a minimal impact on price. For instance, you may decide to purchase below the VWAP and sell above it, ensuring the price is pushed back to an average, instead of being pushed away from it, therefore, maintaining a market that is orderly.
These are just two of many different ways that VWAP can be used. We hope that this has helped you to get a better understanding of VWAP and why it is so important for traders today. It can help you to take your trading to the next level.
Want to take your trading to the next level with VWAP? Click here to learn more.
Now it includes several other bonus scripts that weren’t there before:
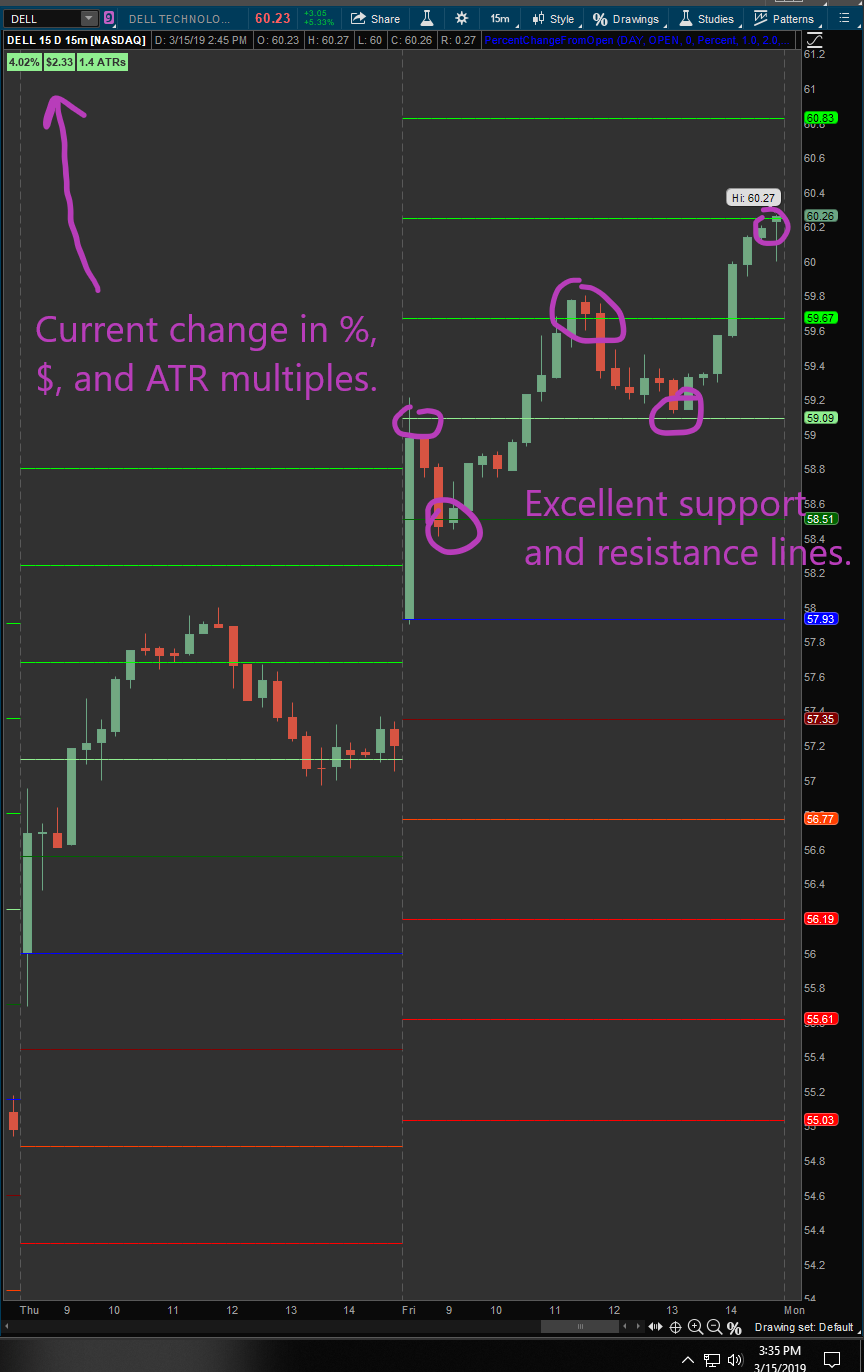
All new indicator showing percent change, dollar change, and ATR-multiple change from open (or any other starting price)
Max % gained column
Max % lost column
Max % Gained or Lost column (based on closing direction)
Column showing % of today’s bar closes that were above a chosen moving average (to sort a watchlist by relative intraday trend strength)
This is what the new indicator looks like:
Percent Change From Open indicator
Changes take effect immediately, and as always, prior purchasers get all updates for free in their My Account > Orders > View Order Details screen.
Love you guys, thanks!
-Josiah
Josiah is a stock & futures trader, ThinkScript programmer, Bitcoin maximalist, gold bug, real estate investor, and budding mountaineer. He's also rumored to be an in-shower opera singer. Josiah started Easycators in 2014 and lives with his family near Nashville, TN. xTwitter | YouTube
This website uses cookies to improve your experience. We'll assume you're okay with this, but you can opt-out if you wish. Accept | Read More
Privacy
Privacy Overview
This website uses cookies to improve your experience while you navigate through the website. Out of these, the cookies that are categorized as necessary are stored on your browser as they are essential for the working of basic functionalities of the website. We also use third-party cookies that help us analyze and understand how you use this website. These cookies will be stored in your browser only with your consent. You also have the option to opt-out of these cookies. But opting out of some of these cookies may affect your browsing experience.
Necessary cookies are absolutely essential for the website to function properly. This category only includes cookies that ensures basic functionalities and security features of the website. These cookies do not store any personal information.
Any cookies that may not be particularly necessary for the website to function and is used specifically to collect user personal data via analytics, ads, other embedded contents are termed as non-necessary cookies. It is mandatory to procure user consent prior to running these cookies on your website.